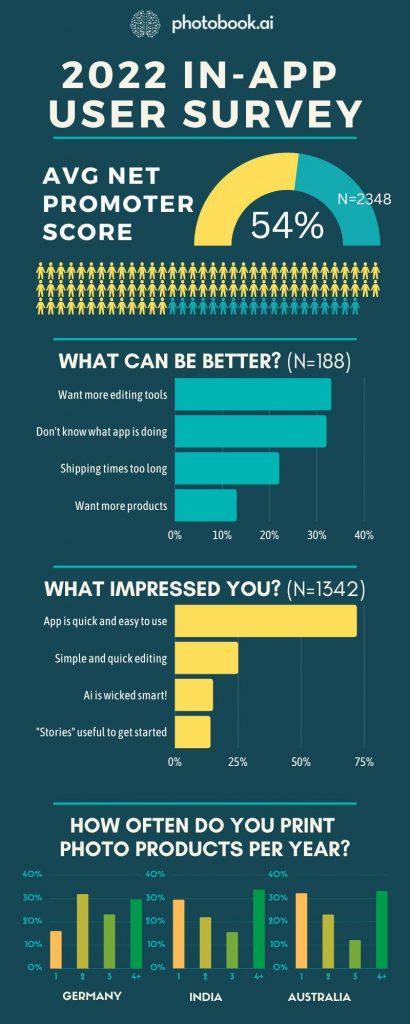
In our 2022 App Performance review, our app has been rated 4.89 stars at the AppStores (weighted average across multiple white-labeled apps and markets) and an Net Promoter Score of 54% (NPS).
We are a huge proponent of being data-driven and transparent in evaluating our app performance. Our white-label print-on-demand apps have been out for quite a few years now, and our 3rd generation of the app have been very well-received by our clients and operators of the app. But we wanted to know what their customers actually think and what should we focus dev efforts on. More AI? More templates? More editing? Or simply more payment options?
So, in October 2021, we added a short in-app survey which shows up at the end of the user-journey which asks just ONE compulsory question, with 2 optional ones after. Then we forgot all about it. As we were planning for 2023, we asked: what’s next, and that’s when someone said: I think we put out a survey, no?
This is what the survey looks like. The questions are EXACTLY the same across all our white-label apps, only in different languages for each territory. We used good-old Google forms which shows up in an embedded browser within the app. So it doesn’t even look perfect.
2022 App NPS Performance Results

NPS – Net Promoter Score is a standardized metric created by Bain and Company to measure customer satisfaction and specifically, how likely they are going to recommend your business to their friends. Read more about it here.
It essentially asks a very simple question:
“On a scale of 0 to 10, how likely are you to recommend this app to your friends?” (yes, there are 11 possible ratings, not 10)
And this is how you calculate your score:

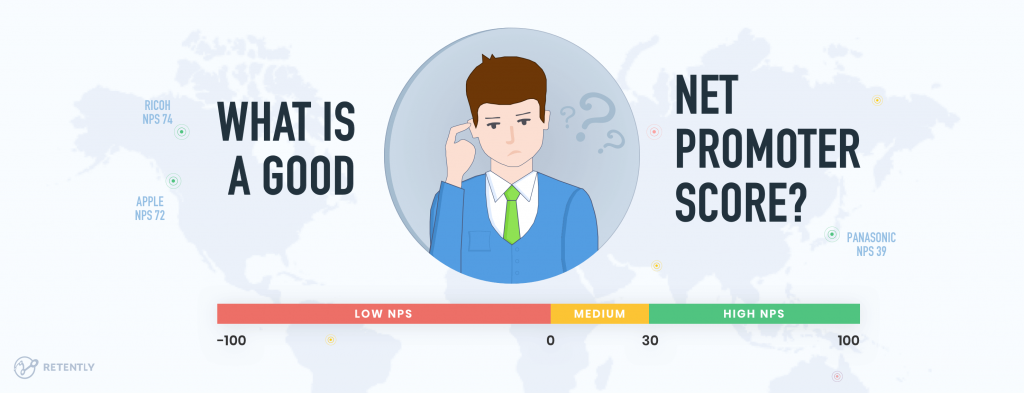
So what is a good NPS Score?
According to Bain: above 0 is Good, 50+ is Excellent and 80+ is world-class.
Apple (who is a huge proponent of the NPS and started tracking it in 2007) has an average of 61 in 2020.
More about that average...
Any good student of statistics and polling knows “averaging” is a fool’s game. Case in point: “on average, human beings on earth have one testicle”.
We looked at the NPS survey results from 5 of our white-labelled apps in markets as varied as India, UK and Germany. We wanted geographic spread and also statistically significant results in terms of respondents.
The number of respondents ranged from 170+ to 1200. (Some apps have been in the wild for longer)
The range of NPS scores we got were from 27% to 63%. The standard error ranged from 4.3% to 1.7%. We then took a weighted average for each app based on the number of responses for each app normalized by the total responses across the 5 apps. The weighted average of the error range is 3.17%. So the “real” range of our NPS is low 50’s to high 50’s. Not a qualitative difference, but something we’ll look at in 2023.
(source reference: How to make sure your NPS sample size is large enough)
Taking a deeper dive...
HOW WE DID IT
Qualitative and quantitative consumer research are not without their pitfalls, which are well-reported. So we always take extra care in designing the questions and even the order of the answers.
This is not one of those surveys designed to make us look good. In fact, it was meant to only be shared with the client of each app and internally.
Our objectives were to get actionable feedback to improve the app and inform allocation of R&D resources (not to make a brag-post) So for all the respondents who gave us a score of 8 and below (the “neutrals and detractors”), we will ask them “How can we do better?” We figured, these are the ones who weren’t impressed, so they are the best persons to tell us what went wrong for them.
Only respondents who indicated a 9 or 10 (the “promoters”) gets the question “What about the app impressed you?” and we were surprised we got 7X more respondents going down this track!
This validates the high NPS score which tells us most users are impressed with the app and are going to be vocal about it: not just with us, but also to their friends!
WHAT WE MIGHT DO DIFFERENTLY
Of course, they also gave us conflicting responses in some cases…”App is slow, I don’t know what the app is doing” was the 2nd most-cited in Q2a (detractors), which contradicts “App is quick and easy to use” in Q2b (promoters), which is the most cited answer in that track.
In absolute terms, we can safely conclude that way more users think the app is quick and easy to use. (73% of 1342 vs 33% of 188). But we are thinking of switching up the order of the responses and questions this year to see if we get similar responses.
Users also asked for conflicting things: they appreciate that editing their photobooks are simple and quick, but yet, they want more editing tools.
We purposely limited editing functionalities in the app as we all know the challenges of editing photos and layouts on a mobile screen. So the challenge this year for us will be to introduce more editing tools, but using AI to assist to keep them smart and quick to use.
For example, whilst users can crop their photos, they almost never have to do so, as our Saliency analysis always ensures the subject of each photo are well-framed.
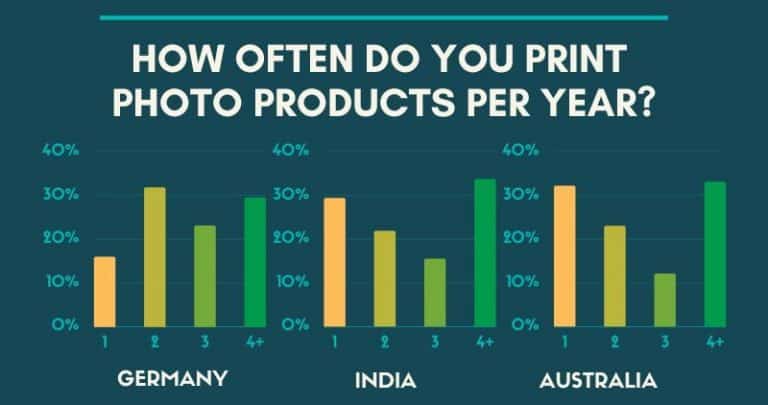
How often do you print a year?

This is the 20-billion dollar question the industry is asking. The conventional wisdom in the western markets is that consumers print twice a year: and we see this in Germany, where it’s usually the summer vacation and the end of year peak gifting season.
Interestingly, in our survey, for all the other markets, more users are saying they will do it more than 4 times a year compared with the ones who only prints once a year!
This is an encouraging response, and something we are working on improving in 2023 as we bake-in subscription features into the white-label stack as a standard feature. This will enable our clients to create multiple combinations of cross-selling, up-selling and recurring revenue streams.
We fully expect to be able to migrate users from the left side of these bar-charts to the right…and even to 12 times a year!
Afterall, the app is already inside the camera and always connected in your pocket.
Next, we looked into the appstore ratings and customer feedback we have been getting. Some of our clients have actively promoted the app, some have not. So we have to take these feedback with a pinch of salt…we know there are lots of crazies out there… we had one user give us a 1 star because the salesperson at the store where she picked up her photos was rude to her!
So in a complex and multi-faceted business such as on-demand printing, how an app or service is rated depends not just on the app’s stability, responsiveness and other feature sets, it also depends on product value-perception, customer service, shipping times and even payment options! Drop the ball on any one customer-interaction interface and you will be sure to get a 1-star kick in the rear.
We are hence very grateful to have white-label clients who are also at the top of their game: they work hard at giving their customers great value, high quality products and excellent service. Hence, this rating is not just a review of our app, but also a rating for the entire village behind each app in each market.
We always say, developing an app is like having children. It’s only fun in the “making of” phase. Once they grow up, it takes a village to maintain, nurture and service them. It gets more and more expensive, but the ROI of a full native app experience is worth the trouble.
We are featuring here some of the feedback we are seeing from the appstore. This is just a tiny fraction of the thousands we have gotten across our dozen or so apps out there.


